Quick answer: A sales forecast template lists one row per open deal with value, stage, stage close rate, weighted value, category, close date, days in current stage, next step, whether the economic buyer is engaged, risk and last contact, then rolls those into a team number. Run two or three forecasting methods and investigate the gap between them rather than averaging it; the gap is where the bad assumption lives.
A sales forecast is a commitment rather than a prediction, and that distinction explains most of why they are wrong. Predictions can be optimistic without consequence; commitments get used to plan hiring and cash, so a forecast that misses by 20% is a bad decision that already happened.
What is a sales forecast?
A sales forecast is a committed estimate of the revenue a team will close in a defined period, built from the open deals in the pipeline and the historical rate at which deals like them close. It differs from a target, which is what you want, and from a projection, which carries no commitment.
The distinction matters operationally. A target motivates; a forecast gets used to decide whether to hire two people or four.
What are the sales forecasting methods?
Three methods cover almost all B2B forecasting, and each is wrong in a different direction, which is why running more than one is the single most useful habit in forecasting. HubSpot's sales forecasting guide reaches a similar split.
1. Stage-weighted. Multiply each deal's value by the historical close rate of its current stage.
| Stage | Historical close rate | Deal value | Weighted |
|---|
| Discovery | 10% | $40,000 | $4,000 |
| Demo complete | 25% | $40,000 | $10,000 |
| Proposal sent | 50% | $40,000 | $20,000 |
| Verbal yes | 85% | $40,000 | $34,000 |
Mechanical, fast and hard to fudge, but it assumes every deal in a stage is equally likely. A deal that has sat in Proposal for 90 days is not 50%.
2. Commit, best case, pipeline. Each rep sorts deals into three buckets: Commit means it will close, Best case means it could with everything going right, Pipeline is everything else. The forecast is Commit plus a historical percentage of Best case. It uses rep judgment, which is better informed than a stage average, and it is only as honest as the culture: if reps are punished for a low Commit, Commit inflates.
3. Run rate. Project recent performance forward, adjusted for seasonality. It takes five minutes and is often more accurate than either of the above for stable, high-volume businesses, but it is blind to anything that changed.
What is the best forecasting method for sales?
No single method is reliably most accurate, and the best practice is running two and investigating the difference rather than averaging it. Averaging hides the disagreement; investigating it finds the deal everyone is wrong about.
If you run only one, use commit/best case for most B2B teams, and cross-check it against run rate once a month. If your bottom-up number is 40% above run rate, one of the two is wrong and it is worth ten minutes to find out which.
What should a sales forecast template include, column by column?
Fifteen columns, one row per deal. Six of them are the ones most forecasts leave out, and those six are where the accuracy lives.
| Column | What goes in it |
|---|
| Account | Customer name |
| Deal name | Short description |
| Owner | Rep |
| Value | Annual contract value |
| Stage | Current stage |
| Stage close rate | Historical rate for that stage |
| Weighted value | Value × stage close rate |
| Category | Commit / Best case / Pipeline |
| Expected close date | The date, not the month |
| Days in current stage | Today minus date entered stage |
| Next step | The specific next action |
| Next step date | When it happens |
| Economic buyer engaged | Yes / No |
| Risk | One line, plain words |
| Last contact | Date |
Days in current stage is the single best predictor of a deal slipping; sort descending and you have your at-risk list. Next step and next step date decide whether a deal belongs in Commit at all; an empty cell means no. Economic buyer engaged catches Commit deals where the signer has never been on a call. Last contact turns three weeks of silence into a visible problem. Risk in plain words: "waiting on legal" is useful, "medium" is not.
Add two more tabs. A roll-up tab with rep, quota, commit, best case, weighted pipeline, closed and gap. And a history tab with month, forecast, actual, variance and one line on why. Without it you cannot know whether your Commit bucket historically lands at 90% or 60%, which means you cannot convert anyone's forecast into a real number.
How do you calculate a sales forecast?
Multiply each bucket by its historical conversion rate and add the results. A worked example for a team of five with a $500,000 quarterly quota:
| Rep | Commit | Best case | Weighted pipeline |
|---|
| A | $80,000 | $60,000 | $95,000 |
| B | $65,000 | $90,000 | $110,000 |
| C | $110,000 | $40,000 | $120,000 |
| D | $45,000 | $120,000 | $140,000 |
| E | $90,000 | $30,000 | $85,000 |
| Total | $390,000 | $340,000 | $550,000 |
History says Commit lands at 88% and Best case at 22%.
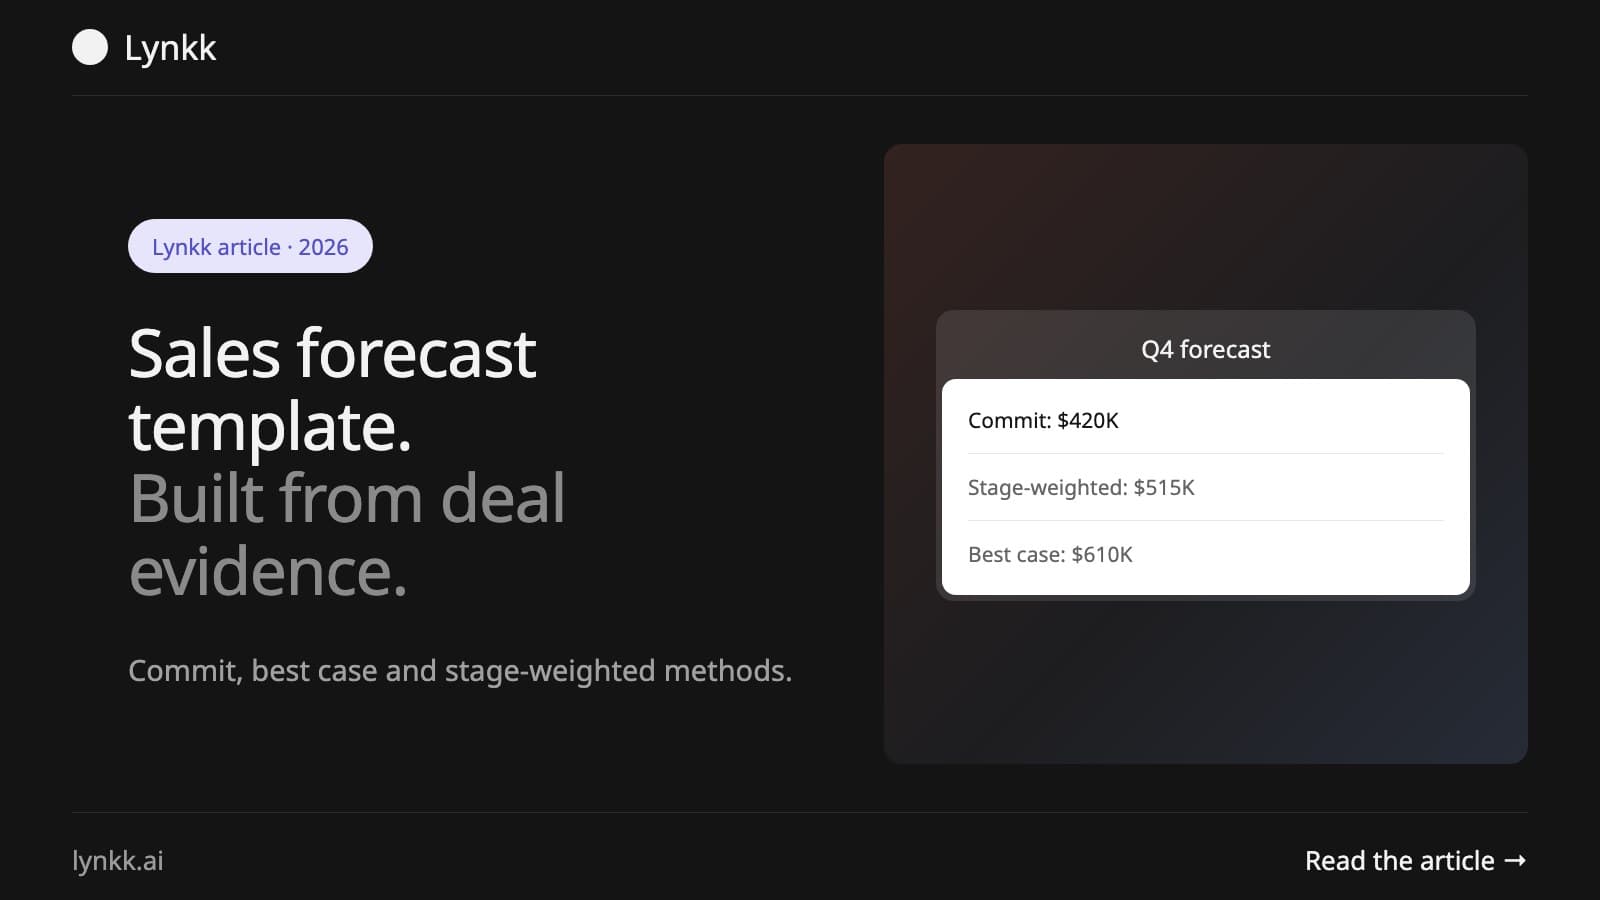
- Commit: $390,000 × 0.88 = $343,200
- Best case: $340,000 × 0.22 = $74,800
- Forecast: $418,000
Weighted pipeline says $550,000. Run rate says $445,000. Three methods, a $132,000 spread, and that spread is the conversation: the weighted number is high because Rep D has $120,000 in Best case, worth $26,400 at historical conversion, not $120,000.
How do you forecast sales in Excel?
Build it as three tabs rather than one sheet, because the history tab is what makes the other two accurate over time. Four formulas do most of the work:
- Weighted value:
=D2*F2 (value × stage close rate)
- Days in stage:
=TODAY()-J2
- Forecast:
=SUMIF(Category,"Commit",Value)*0.88 + SUMIF(Category,"Best case",Value)*0.22
- Variance:
=(Actual-Forecast)/Forecast
Replace 0.88 and 0.22 with your own rates as soon as the history tab has three or four quarters in it. Borrowed conversion rates are a guess wearing a formula.
Why can sales forecasts be inaccurate?
Four habits cause most misses, and none of them are about the math.
-
Nobody writes down why a deal is in Commit. "It's a commit" is a feeling. "The economic buyer said on October 14 that legal review finishes the 28th and they sign the week after" is a reason that survives a slipped date.
-
Close dates get set by the rep's quarter, not the buyer's process. A six-week procurement cycle will not finish in three because your quarter ends. Set close dates from the buyer's steps, working backwards.
-
Deals never move backwards. If a champion leaves and the deal stays in the same stage, your pipeline has stopped reflecting reality.
-
The forecast is a number with no story behind it. "$80,000" tells you nothing. "$80,000: Acme is $50k with budget confirmed and the signer on Thursday's call; Bluestone is $30k but legal has not started" tells you what could go wrong and when you will know.
How do you calculate sales forecast accuracy?
Accuracy is the variance between the called number and the actual, expressed as a percentage: (actual − forecast) ÷ forecast. Many teams aim to land within 5 to 10%, but the more useful early target is consistency, because a forecast reliably 15% high can be corrected while one that swings cannot be used at all.
Track it on the history tab every month with one line explaining the variance. Three or four quarters of that improves forecast accuracy more than any process change.
How do you run a weekly forecast review?
Thirty minutes, same time, same six-item format, prepared the way our meeting preparation guide describes:
- Closed since last week
- Deals that entered Commit, and why
- Deals that left Commit, and why
- The three oldest deals in each stage
- Deals forecast this month with no contact in 14 days
- Updated number
Item 3 is the one people skip and the one that teaches most. A deal leaving Commit tells you how qualification is working, as well as what happened to that one deal.
Where the forecast numbers actually come from
Every forecast process has the same weak point: the CRM records what the rep typed days after the call, filtered through how they want the deal to look. Two things help, and only one of them is a process change.
First, ask for evidence rather than status. Instead of "is budget confirmed?", ask "who said that, and when?" Second, keep a record of the call that does not depend on memory; our guide to sales conversation intelligence covers the options. If your team records its calls with Lynkk, each call gets a summary and action items, and on Pro you can ask a question across all your notes and get an answer with numbered sources that point back to the calls. "Acme said on September 3 that the migration finishes the 30th" then becomes a forecast input rather than a recollection. Lynkk does not sync with a CRM today, so you copy the summary into your CRM yourself.
Copy-paste forecast template
SALES FORECAST: [Quarter]
Prepared: [date]        Quota: [amount]

DEALS
Account | Deal | Owner | Value | Stage | Stage % | Weighted |
Category | Close date | Days in stage | Next step | Next step date |
EB engaged | Risk | Last contact

ROLL-UP
Rep | Quota | Commit | Best case | Weighted | Closed | Gap

FORECAST
Method 1 (Commit × historical + Best case × historical):
Method 2 (weighted pipeline):
Method 3 (run rate):
Spread:
Where the gap comes from:

CALLED NUMBER:
Confidence (high / medium / low):
What would have to go wrong:

HISTORY
Month | Forecast | Actual | Variance | Why
Frequently asked questions
What is a sales forecast template?
A structured format for projecting revenue over a period, listing each open deal with its value, stage, probability, close date and risk, then rolling those into a total.
What are the main sales forecasting methods?
Stage-weighted, commit/best case/pipeline, and run rate. Each is wrong in a different direction, which is why running two and comparing them beats perfecting one.
Which sales forecasting method is most accurate?
None reliably. Running two or three and investigating the gap produces better numbers than optimizing a single method.
How often should you update a sales forecast?
Weekly for the current quarter. Deals change faster than a monthly cadence can capture.
What is the difference between commit and best case?
Commit means the rep is confident the deal closes in the period; best case means it could with everything going right. Commit should land at 85% or better, and if yours does not, the definition is not being applied.
How do you calculate sales forecast accuracy?
Variance between the called number and the actual, as a percentage of the forecast. Track it monthly with a one-line explanation.
Why do sales forecasts miss?
Close dates set from the seller's quarter rather than the buyer's process, deals that never move backwards, commit decisions based on feeling rather than evidence, and no history of past accuracy to calibrate against.